すべての特徴量同士の関係について、目的変数を条件付けたもとでの条件付き独立をnaiveに仮定するモデル
特徴量のもとでの目的変数の確率を次のように表す
条件付き独立の仮定により
なので式は簡素化され
は入力を所与とすると定数なので
例
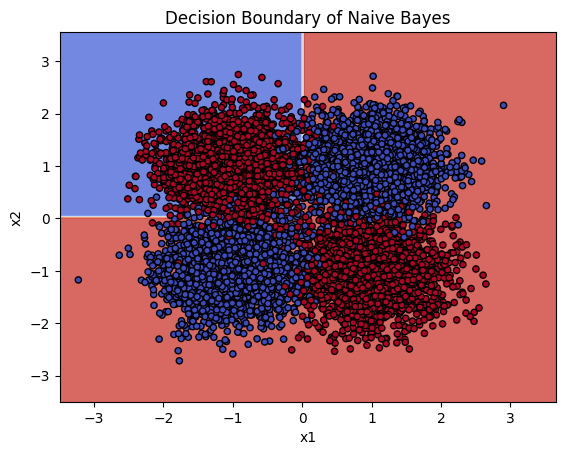
線形分離不可能問題が解けない様子
# データの用意
import numpy as np
from sklearn.datasets import make_blobs
centers = [(1, 1), (1, -1), (-1, 1),  (-1, -1)]
X, y = make_blobs(n_samples=10000, n_features=2, centers=centers, cluster_std=[0.5, 0.5, 0.5, 0.5], random_state=0)

def replace_label(y):
    if y == 2:
        return 1
    if y == 3:
        return 0
    return y

y = np.array(list(map(replace_label, y)))

import matplotlib.pyplot as plt
fig, ax = plt.subplots()
for y_val in set(y):
    idx = y == y_val
    ax.scatter(X[idx, 0], X[idx, 1], label=f"y == {y_val}", alpha=0.3)
ax.legend()
fig.show()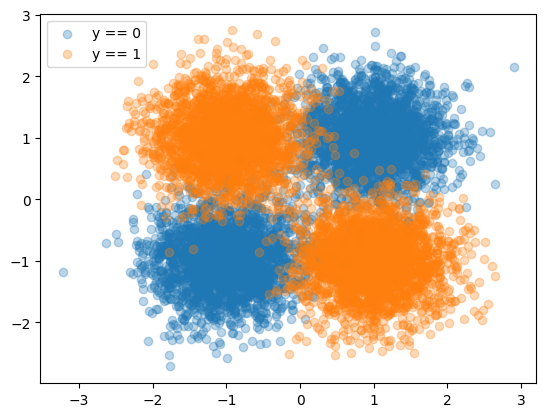
from sklearn.model_selection import train_test_split
X_train, X_test, y_train, y_test = train_test_split(X, y, test_size=0.33, random_state=42)
from sklearn.naive_bayes import BernoulliNB
clf = BernoulliNB()
clf.fit(X_train, y_train)Loading...
from sklearn.metrics import ConfusionMatrixDisplay
ConfusionMatrixDisplay.from_estimator(clf, X_test, y_test)
<sklearn.metrics._plot.confusion_matrix.ConfusionMatrixDisplay at 0x7f99a9752d30>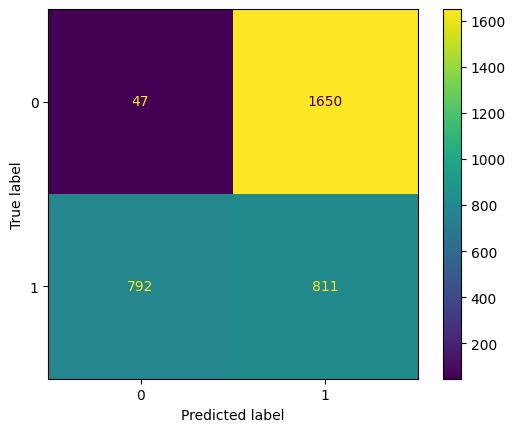
Source
from sklearn.inspection import DecisionBoundaryDisplay
fig, ax = plt.subplots()
disp = DecisionBoundaryDisplay.from_estimator(
    clf,
    X_test,
    response_method="predict",
    cmap=plt.cm.coolwarm,
    alpha=0.8,
    ax=ax,
    xlabel="x1",
    ylabel="x2",
)
ax.scatter(X[:, 0], X[:, 1], c=y, cmap=plt.cm.coolwarm, s=20, edgecolors="k")
ax.set(title="Decision Boundary of Naive Bayes")
fig.show()