まっすぐ撮影できずに台形になっているような状態はperspective歪みなどと呼ばれる
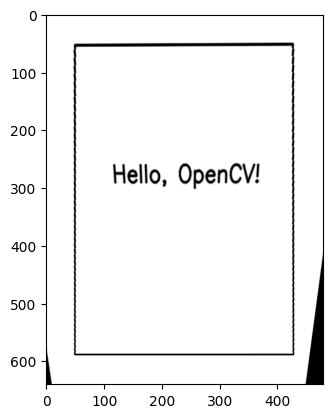
射影変換 (projective transformation)によって台形補正を行う
非線形な歪みの補正はできない。例えば書類をスキャンするときに隙間が空いていて、たわんでいる状態でスキャンした文書の補正はできない。
方法
例えば画像内に長方形になるべきものが写っている場合、4点を検出して、まっすぐな歪みのない長方形にアフィン変換してやればよい。
点はkeypoints検出や直線検出の結果をもとに推定する
局所対応点(keypoints)を検出して、4点にまとめる
例えばコーナー検出(corner detection)によって「角っぽい点」を全部検知してから適切にフィルタリング・統合する
線が直交する点が角なので、線を検出して直交点を推測する
例えばハフ変換。ただし、太い線だと並行に検出するとは限らない。候補の線を全部出してしまう。Cannyなどで細線化する方法があるが、細線化が失敗すると後の工程が全部失敗するリスクもある
例えばLSD(Line Segment Detection)
画像の例
Source
import cv2
import numpy as np
import matplotlib.pyplot as plt

# 白い背景の画像を作成
width, height = 480, 640
img = np.ones((height, width, 3), dtype=np.uint8) * 255

# 台形の頂点を定義
pts = np.array([[100, 100], [400, 100], [450, 500], [50, 500]], np.int32)
pts = pts.reshape((-1, 1, 2))
# 台形を描画
cv2.polylines(img, [pts], isClosed=True, color=(0, 0, 0), thickness=2)

font = cv2.FONT_HERSHEY_SIMPLEX
cv2.putText(img, 'Hello, OpenCV!', (140, 250), font, 1, (0, 0, 0), 2, cv2.LINE_AA)

# 円を描く
# cv2.circle(img, (250, 250), 100, (0, 0, 0), 1)

plt.imshow(img)
plt.show()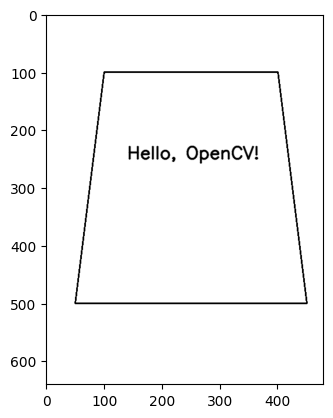
前処理:台形の輪郭線を取り出す
# 前処理:台形の輪郭線を取り出す

# グレースケール画像の取得
gray = cv2.cvtColor(img, cv2.COLOR_BGR2GRAY)

# 二値化
_, binary = cv2.threshold(gray, 128, 255, cv2.THRESH_BINARY_INV)

# モルフォロジー変換:膨張と収縮を繰り返して線を抽出
kernel_length = max(1, img.shape[1] // 80)  # カーネルのサイズを画像の幅に基づいて決定
kernel = cv2.getStructuringElement(cv2.MORPH_RECT, (10, 1))
morph = cv2.morphologyEx(binary, cv2.MORPH_CLOSE, kernel, iterations=2)

plt.imshow(morph, cmap="gray")
plt.show()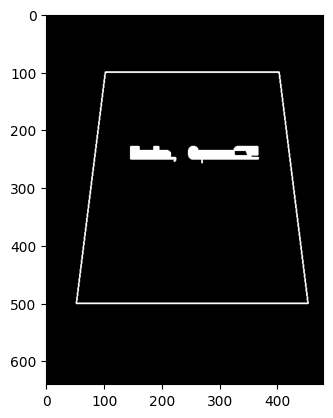
contours, _ = cv2.findContours(morph, cv2.RETR_EXTERNAL, cv2.CHAIN_APPROX_SIMPLE)

# 輪郭を描画
contour_img = np.zeros_like(gray)
cv2.drawContours(contour_img, contours, -1, (255, 255, 255), 2)

plt.imshow(contour_img, cmap="gray")
plt.show()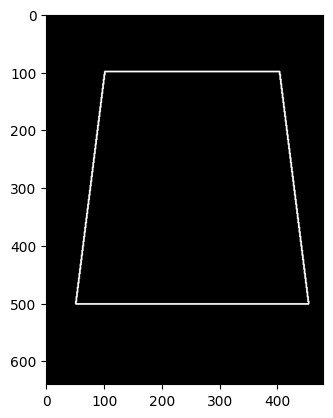
前処理:平滑化
# 前処理2

# 白黒を反転
contour_img = 255 - contour_img

# 線がギザギザしているのでガウシアンブラーで平滑化
contour_img = cv2.GaussianBlur(contour_img, (5, 5), 0)

plt.imshow(contour_img, cmap="gray")
plt.show()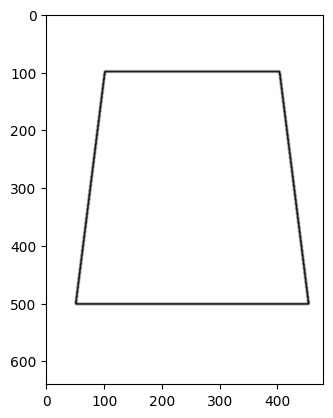
局所対応点を検出する方法
Harrisによるコーナー検出
# Harris corner detection
dst = cv2.cornerHarris(np.float32(contour_img), blockSize=2, ksize=3, k=0.04)
# Dilate the result to mark the corners
dst = cv2.dilate(dst, None)
# Threshold for an optimal value, marking the corners in the original image
img_harris = img.copy()
img_harris[dst > 0.01 * dst.max()] = [0, 0, 255]

plt.imshow(img_harris)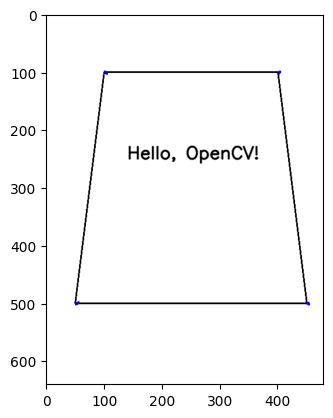
FASTによるコーナー検出
FASTは16x16ピクセルの範囲ごとにグレースケール画像の濃淡の領域を分割するように決定木を構築してコーナーを検出する手法
fast = cv2.FastFeatureDetector_create(threshold=100)
keypoints = fast.detect(contour_img, None)

# 検出されたコーナーを画像に描画
image_with_keypoints = cv2.drawKeypoints(img, keypoints, None, color=(255, 0, 0))

plt.imshow(image_with_keypoints)
plt.title("Corners Detected by FAST")
plt.show()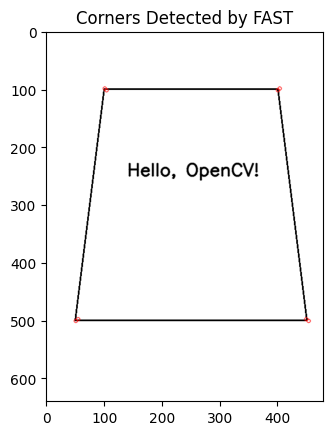
検出したコーナーたちを4点にまとめる
# コーナーの座標を取得
corners = cv2.KeyPoint_convert(keypoints)
corners
array([[101., 99.],
[403., 99.],
[104., 102.],
[400., 102.],
[ 55., 498.],
[449., 498.],
[ 51., 501.],
[453., 501.]], dtype=float32)from sklearn.cluster import KMeans
kmeans = KMeans(n_clusters=4)
kmeans.fit(corners)
centroids = kmeans.cluster_centers_
centroidsarray([[401.5, 100.5],
[451. , 499.5],
[ 53. , 499.5],
[102.5, 100.5]], dtype=float32)values = centroids[:, 0] + centroids[:, 1]
idx = np.argsort(values)
centroids = centroids[idx]
centroidsarray([[102.5, 100.5],
[401.5, 100.5],
[ 53. , 499.5],
[451. , 499.5]], dtype=float32)img_centroids = image_with_keypoints.copy()
for centroid in centroids:
cv2.circle(img_centroids, tuple(centroid.astype("uint32")), radius=5, color=(0, 0, 255), thickness=2)
plt.imshow(img_centroids)
plt.title("Corners Detected by FAST")
plt.show()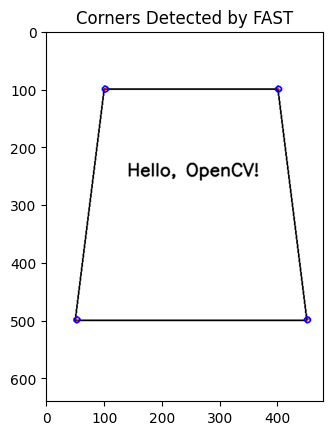
Perspective Transform
pts_src = centroids# 変換後の座標(出力画像のサイズを決定)
# width, height = 300, 400 # 出力画像の幅と高さを指定
margin = 50 # 余白
pts_dst = np.array([
[margin, margin],
[width - margin - 1, margin],
[margin, height - margin - 1],
[width - margin - 1, height - margin - 1]
], dtype='float32')
pts_dstarray([[ 50., 50.],
[429., 50.],
[ 50., 589.],
[429., 589.]], dtype=float32)# 変換行列を計算
matrix = cv2.getPerspectiveTransform(pts_src, pts_dst)
# 変換を適用
transformed_img = cv2.warpPerspective(img, matrix, (width, height))
plt.imshow(transformed_img, cmap="gray")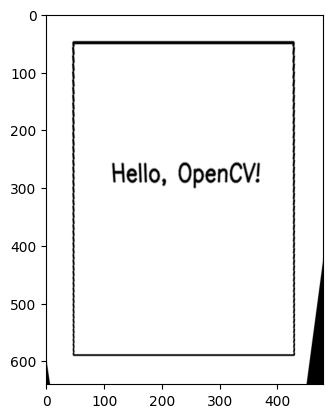
直線を検出する場合
LSDはライセンスの問題でOpenCVからは削除されたようで、使いたい場合は pylsd をインストールする必要がある。
代わりに FastLineDetector というものがある。(Python使用例:Python+OpenCVによる線分検出 - 社会人研究者が色々頑張るブログ)
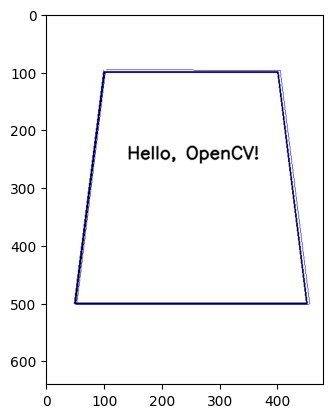
直線を検出する
ぴったり4つではなく8つくらい出てる
length_threshold = 10
distance_threshold = 1.41421356
canny_th1 = 50
canny_th2 = 50
canny_aperture_size = 3
do_merge = False

fld = cv2.ximgproc.createFastLineDetector(
    length_threshold,
    distance_threshold,
    canny_th1,
    canny_th2,
    canny_aperture_size,
    do_merge
)

lines_raw = fld.detect(contour_img)
# 形状を整える
lines = [line[0] for line in lines_raw]

# drawSegmentsで描く場合
# img_lines = fld.drawSegments(img, lines)
# plt.imshow(img_lines)

# cv2.lineで描く場合
print(f"{len(lines)} lines are detected")
out = img.copy()
for line in lines:
    x1, y1, x2, y2 = map(int, line)
    cv2.line(out, (x1, y1), (x2, y2), (0, 0, 255), 1)
plt.imshow(out)
8 lines are detected
def extend_line(p1, p2, length):
    diff = np.array(p2) - np.array(p1)
    direction = diff / np.linalg.norm(diff)
    new_p1 = np.array(p1) - direction * length
    new_p2 = np.array(p2) + direction * length
    new_p1 = tuple(map(int, new_p1))
    new_p2 = tuple(map(int, new_p2))
    return new_p1, new_p2
out = img.copy()
for line in lines:
x1, y1, x2, y2 = map(int, line)
p1_, p2_ = extend_line(p1=(x1, y1), p2=(x2, y2), length=50)
cv2.line(out, p1_, p2_, (0, 255, 0), 1)
# break
plt.imshow(out)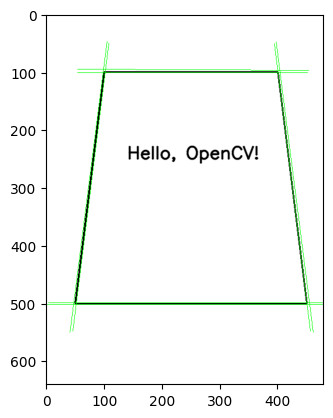
def get_line_intersection(line1, line2):
    x1, y1, x2, y2 = line1
    x3, y3, x4, y4 = line2
    # Calculate the determinant
    det = (x1 - x2) * (y3 - y4) - (y1 - y2) * (x3 - x4)
    if det == 0:
        return None  # Lines are parallel or coincident
    # Calculate the intersection point
    px = ((x1*y2 - y1*x2) * (x3 - x4) - (x1 - x2) * (x3*y4 - y3*x4)) / det
    py = ((x1*y2 - y1*x2) * (y3 - y4) - (y1 - y2) * (x3*y4 - y3*x4)) / det
    return int(px), int(py)
out = img.copy()
intersects = []
for i in range(len(lines)):
for j in range(i, len(lines)):
x1, y1, x2, y2 = map(int, lines[i])
p1_, p2_ = extend_line(p1=(x1, y1), p2=(x2, y2), length=50)
cv2.line(out, p1_, p2_, (0, 255, 0), 1)
intersect = get_line_intersection(lines[i], lines[j])
if intersect:
x_, y_ = intersect
if abs(x_) > out.shape[1] or abs(y_) > out.shape[0]:
# 異常値は無視
continue
cv2.circle(out, intersect, radius=5, color=(0, 0, 255), thickness=1)
intersects.append(intersect)
plt.figure(figsize=(10,10))
plt.imshow(out)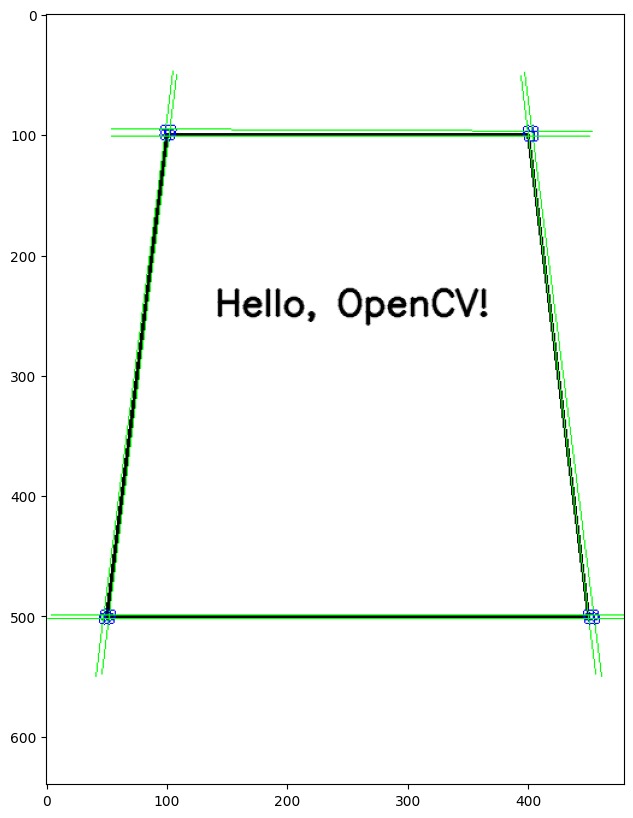
交点の中心点をとる
from sklearn.cluster import KMeans
kmeans = KMeans(n_clusters=4)
kmeans.fit(intersects)
centroids = kmeans.cluster_centers_
centroids
array([[402.25, 99. ],
[ 50.5 , 500.5 ],
[452.5 , 500.5 ],
[100.75, 98. ]])values = centroids[:, 0] + centroids[:, 1]
idx = np.argsort(values)
centroids = centroids[idx]
centroidsarray([[100.75, 98. ],
[402.25, 99. ],
[ 50.5 , 500.5 ],
[452.5 , 500.5 ]])out = img.copy()
for centroid in centroids:
cv2.circle(out, tuple(centroid.astype("uint32")), radius=5, color=(0, 0, 255), thickness=2)
plt.imshow(out)
plt.title("Corners Detected by Intersects of lines")
plt.show()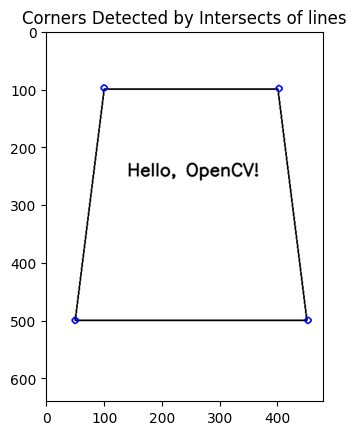
Perspective Transform
pts_src = centroids.astype("float32")# 変換後の座標(出力画像のサイズを決定)
# width, height = 300, 400 # 出力画像の幅と高さを指定
margin = 50 # 余白
pts_dst = np.array([
[margin, margin],
[width - margin - 1, margin],
[margin, height - margin - 1],
[width - margin - 1, height - margin - 1]
], dtype='float32')
pts_dstarray([[ 50., 50.],
[429., 50.],
[ 50., 589.],
[429., 589.]], dtype=float32)# 変換行列を計算
matrix = cv2.getPerspectiveTransform(pts_src, pts_dst)
# 変換を適用
transformed_img = cv2.warpPerspective(img, matrix, (width, height))
plt.imshow(transformed_img, cmap="gray")