Reshef, et al. (2011). Detecting novel associations in large data sets. で提案されたMIC(Maximal Information Coefficient)は、相互情報量を用いてデータの非線形な関連性を評価できる係数。
「21世紀の相関係数(A Correlation for the 21st Century)」としてScience誌に紹介され、話題になった。
相互情報量(Mutual Information; MI)
確率分布 による一般の非線形依存関係の強さを測る。
定義式
離散確率変数の場合:
連続確率変数の場合:
特徴
なら 独立
線形・非線形を問わずあらゆる依存を検出
ただし値域が固定されておらず、相関係数のように簡単には解釈できない
推定には KDE, kNN などが必要
Source
import numpy as np
from sklearn.metrics import mutual_info_score # 離散型確率変数の相互情報量

def discretized_mi(x, y, bins=20):
    # 連続変数を離散化して簡易的に相互情報量を求める
    # x, y を bins 個の等幅ビンに離散化
    x_binned = np.digitize(x, np.histogram_bin_edges(x, bins=bins))
    y_binned = np.digitize(y, np.histogram_bin_edges(y, bins=bins))

    # 離散化した値で MI を計算
    return mutual_info_score(x_binned, y_binned)

import matplotlib.pyplot as plt
fig, axes = plt.subplots(figsize=[10, 2.5], ncols=3)

true_r = 0
mu = np.array([0.0, 0.0])
Sigma = np.array([[1.0, true_r], [true_r, 1.0]])
samples = np.random.multivariate_normal(mu, Sigma, size=100)
x = samples[:, 0]
y = samples[:, 1]
axes[0].scatter(x, y)
axes[0].set_title(f"Mutual Info = {discretized_mi(x, y):.3f}")

x = np.linspace(-10, 10, 15)
y = 1 / (1 + np.exp(-x))
axes[1].scatter(x, y)
axes[1].set_title(f"Mutual Info = {discretized_mi(x, y):.3f}")

x = np.linspace(-3.14,3.14, 100)
y = x**2 + np.random.random(len(x))
axes[2].scatter(x, y)
axes[2].set_title(f"Mutual Info = {discretized_mi(x, y):.3f}")

%matplotlib inline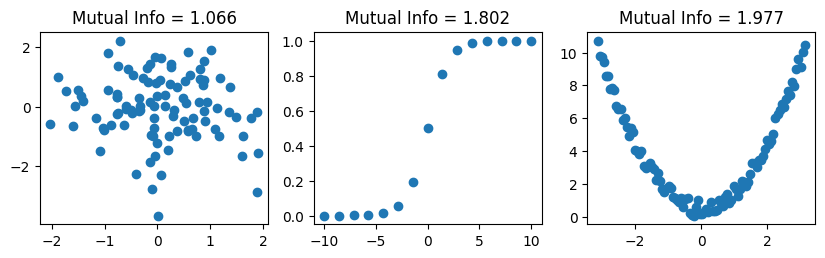
MIC(Maximal Information Coefficient)
概念的な定義
散布図をさまざまな格子分割 に切り、各ビンの相対頻度から 相互情報量 を計算し、その最大値をスケール正規化したもの。
MIC は相互情報量を複数グリッドで最大化し、
となるように正規化した指標。
特徴
単調・非単調のどちらも検出
関係の形状が分からない探索フェーズに強い
計算はやや重いが実務では十分使える
参考
- Reshef, D. N., Reshef, Y. A., Finucane, H. K., Grossman, S. R., McVean, G., Turnbaugh, P. J., Lander, E. S., Mitzenmacher, M., & Sabeti, P. C. (2011). Detecting Novel Associations in Large Data Sets. Science, 334(6062), 1518–1524. 10.1126/science.1205438
- Speed, T. (2011). A Correlation for the 21st Century. Science, 334(6062), 1502–1503. 10.1126/science.1215894
- Speed, T. (2011). A Correlation for the 21st Century. Science, 334(6062), 1502–1503. 10.1126/science.1215894