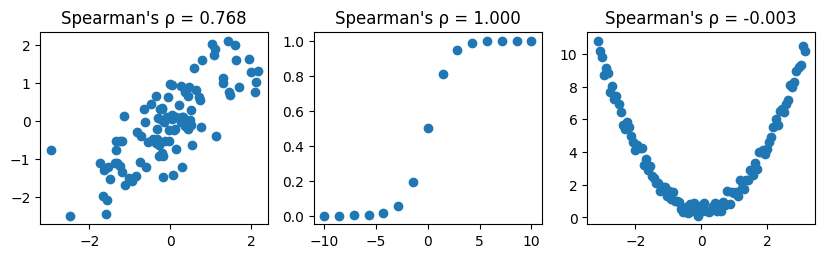
Spearmanの順位相関係数はデータの順位(rank)に基づき、単調な非線形関係を検出できる。
定義式
ここで
は 番目の観測における と の順位の差
はサンプルサイズ
特徴
単調(増加・減少)であれば非線形も検出できる
値域は
外れ値にやや強い
Source
from scipy.stats import spearmanr
import matplotlib.pyplot as plt
import numpy as np

fig, axes = plt.subplots(figsize=[10, 2.5], ncols=3)

true_r = 0.75
mu = np.array([0.0, 0.0])
Sigma = np.array([[1.0, true_r], [true_r, 1.0]])
samples = np.random.multivariate_normal(mu, Sigma, size=100)
x = samples[:, 0]
y = samples[:, 1]
axes[0].scatter(x, y)
axes[0].set_title(f"Spearman's ρ = {spearmanr(x, y).statistic:.3f}")

x = np.linspace(-10, 10, 15)
y = 1 / (1 + np.exp(-x))
axes[1].scatter(x, y)
axes[1].set_title(f"Spearman's ρ = {spearmanr(x, y).statistic:.3f}")

x = np.linspace(-3.14,3.14, 100)
y = x**2 + np.random.random(len(x))
axes[2].scatter(x, y)
axes[2].set_title(f"Spearman's ρ = {spearmanr(x, y).statistic:.3f}")

%matplotlib inline