VARはARモデルの拡張版であり、VAR()モデルはを定数と自身の次のラグ(期の過去の値)に回帰したモデル。
パラメータ推定
VARは一見複雑だが、本質的には各変数を同じ説明変数で回帰しているだけ(多変量回帰)である。例えばVAR(1) は 。
サンプルサイズを とする(初期 個は捨てる)。
目的変数行列を、説明変数行列を、係数行列をまとめたものをとおく。
VARはOLSで推定可能
import numpy as np
import pandas
import statsmodels.api as sm
from statsmodels.tsa.api import VAR

mdata = sm.datasets.macrodata.load_pandas().data

# prepare the dates index
dates = mdata[['year', 'quarter']].astype(int).astype(str)
quarterly = dates["year"] + "Q" + dates["quarter"]

from statsmodels.tsa.base.datetools import dates_from_str
quarterly = dates_from_str(quarterly)

mdata = mdata[['realgdp', 'realcons']]
mdata.index = pandas.DatetimeIndex(quarterly)
data = np.log(mdata).diff().dropna()

# data
display(data.tail())

# make a VAR model
model = VAR(data)
results = model.fit(2)
results.summary()
Loading...
/home/mitama/notes/.venv/lib/python3.10/site-packages/statsmodels/tsa/base/tsa_model.py:473: ValueWarning: No frequency information was provided, so inferred frequency QE-DEC will be used.
  self._init_dates(dates, freq)
  Summary of Regression Results
==================================
Model:                         VAR
Method:                        OLS
Date:           Fri, 19, Dec, 2025
Time:                     23:32:33
--------------------------------------------------------------------
No. of Equations:         2.00000    BIC:                   -20.0648
Nobs:                     200.000    HQIC:                  -20.1630
Log likelihood:           1465.40    FPE:                1.63813e-09
AIC:                     -20.2297    Det(Omega_mle):     1.55920e-09
--------------------------------------------------------------------
Results for equation realgdp
==============================================================================
                 coefficient       std. error           t-stat            prob
------------------------------------------------------------------------------
const               0.001024         0.000971            1.055           0.291
L1.realgdp         -0.096477         0.087307           -1.105           0.269
L1.realcons         0.571453         0.102953            5.551           0.000
L2.realgdp         -0.038461         0.081226           -0.474           0.636
L2.realcons         0.352325         0.109914            3.205           0.001
==============================================================================

Results for equation realcons
==============================================================================
                 coefficient       std. error           t-stat            prob
------------------------------------------------------------------------------
const               0.004668         0.000843            5.538           0.000
L1.realgdp          0.051847         0.075826            0.684           0.494
L1.realcons         0.194414         0.089414            2.174           0.030
L2.realgdp          0.013699         0.070545            0.194           0.846
L2.realcons         0.181398         0.095460            1.900           0.057
==============================================================================

Correlation matrix of residuals
             realgdp  realcons
realgdp     1.000000  0.603188
realcons    0.603188  1.000000
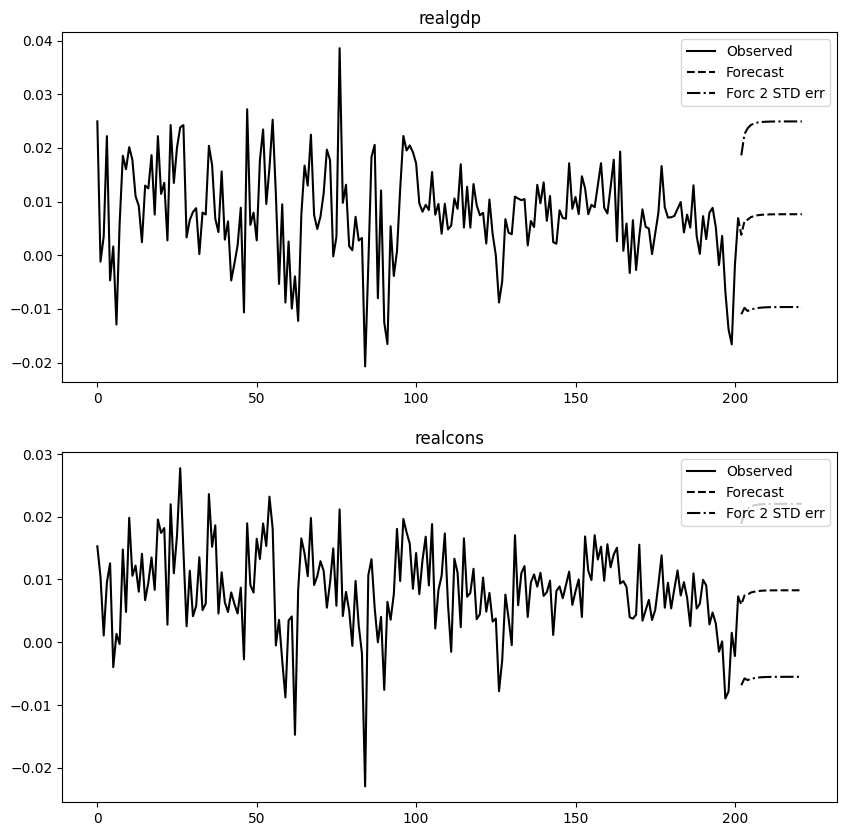
_ = results.plot_forecast(steps=20)