極大と極小
ある関数があるとする。
ある点での値がその近くでのほかの値より大きい場合、はで 極大 (maximum)になるといい、を 極大値 という。
ある点での値がその近くでのほかの値より小さい場合、はで 極小 (minimum)になるといい、を 極小値 という。
極大値と極小値を総称して 極値 という。
極値の判定
極値の条件
極値の判定法
導関数のふるまいで極値を判定できる。まとめると次のようになる。
が増加しながら を通過するとき
導関数 が正から 0 を通って負に符号をかえるならば、 は で極大值 をもつ。
導関数 が負から 0 を通って正に符号をかえるならば、 は で極小值 をもつ。
導関数 が符号をかえないならば、 であっても、 は で極大にも極小にもならない
の符号の判定に2次導関数を使うことができる。
のとき、であることはが減少状態であり、において正から0を通って負になることがわかる。
のとき、であることはが増加状態であり、において負から0を通って正になることがわかる。
Source
import numpy as np
import matplotlib.pyplot as plt
import japanize_matplotlib

def f(x):
    return np.sin(x)

def f1(x):
    return np.cos(x)

def f2(x):
    return -np.sin(x)


x = np.linspace(0, 6, 100)

fig, ax = plt.subplots(figsize=[7, 3])

ax.plot(x, f(x), label=r"$f(x)$", color="steelblue")
ax.plot(x, f1(x), label=r"$f'(x)$", color="dodgerblue", linestyle="--", alpha=0.6)
ax.plot(x, f2(x), label=r"$f''(x)$", color="deepskyblue", linestyle="-.", alpha=0.6)

x0 = np.pi/2
x1 = 3*np.pi/2
ax.axvline(x=x0, color="gray", alpha=0.5, linestyle=":")
ax.axvline(x=x1, color="gray", alpha=0.5, linestyle=":")
ax.axhline(y=0, color="gray", alpha=0.8)

ax.legend()
ax.set(xlabel="x", ylabel="y")
ax.text(x0, f(x0) - 0.15, "極大", color="steelblue", ha="center")
ax.text(x1, f(x1) + 0.15, "極小", color="steelblue", ha="center")
ax.text(x0, f1(x0) - 0.15, r"$f'(x)=0$", color="dodgerblue", ha="center")
ax.text(x1, f1(x1) - 0.15, r"$f'(x)=0$", color="dodgerblue", ha="center")
ax.text(x0, f2(x0) + 0.15, r"$f''(x)<0$", color="deepskyblue", ha="center")
ax.text(x1, f2(x1) - 0.2, r"$f''(x)>0$", color="deepskyblue", ha="center")
fig.show()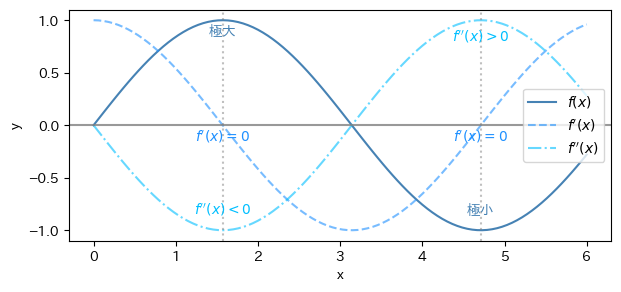
よって、きょくちのはんて
最大値と最小値
閉区間で連続な関数の最大値と最小値を考える。
この場合、次の2点に注意する必要がある。
区間内に極大(または極小)になる点が複数あり得るため、それらを比べて最大値(最小値)を探索する必要がある
区間の端点が最大値(最小値)になる可能性があるため、端点とも比較する必要がある