感度分析#
感度分析(sensitivity analysis)はモデルにさまざまなデータを入力し、推定した因果効果についての妥当性を評価する方法。
入力を変化させたときの出力の変化の「方向(正負)」と「度合い(強さ)」を測る。
E-value#
E-Valueは未観測の交絡因子の影響の強さを簡単に測る方法。
となる。これはRRが1より大きい場合で、もしRRが1より小さくなるなら逆数を用いる。
E-valueが大きいほど、観測された結果と処置の関係は因果関係に近い(ロバストである)と解釈される。
例えばRRが1.5(処置で1.5倍改善)だとE-valueは2.37になる。これは、もし未観測の交絡因子でこの推定結果を説明するには、未観測の交絡因子が結果変数と処置変数の両方と2.37倍の相対リスクで関連している必要があることを示す。
# 例
p_treatment = 0.15 # 処置群での購入割合
p_control = 0.10 # 対照群での購入割合

RR = p_treatment / p_control

import math
E = RR + math.sqrt(RR * (RR - 1))
print(f"E-value: {E:.3g}")
E-value: 2.37
部分決定係数#
Imbens (2003)が提案した、未観測の交絡因子の強さを把握する手法。
共変量
ここで
未観測の交絡因子
実装#
PySensemakrパッケージが便利。
!pip install PySensemakr
import sensemakr as smkr
import statsmodels.formula.api as smf

# loads data
darfur = smkr.load_darfur()
# runs regression model
reg_model = smf.ols(formula='peacefactor ~ directlyharmed + age + farmer_dar + herder_dar + '\
                    'pastvoted + hhsize_darfur + female + village', data=darfur)
darfur_model = reg_model.fit()

# Create a sensemakr object and print summary of results
darfur_sense = smkr.Sensemakr(model = darfur_model,
                              treatment = "directlyharmed",
                              benchmark_covariates = ["female"],
                              kd = [1,2,3])
darfur_sense.summary()
Sensitivity Analysis to Unobserved Confounding

Model Formula: peacefactor ~ directlyharmed + age + farmer_dar + herder_dar + pastvoted + hhsize_darfur + female + village

Null hypothesis: q = 1 and reduce = True

-- This means we are considering biases that reduce the absolute value of the current estimate.
-- The null hypothesis deemed problematic is H0:tau = 0.0

Unadjusted Estimates of ' directlyharmed ':
  Coef. estimate: 0.097
  Standard Error: 0.023
  t-value: 4.184

Sensitivity Statistics:
  Partial R2 of treatment with outcome: 0.022
  Robustness Value, q = 1 : 0.139
  Robustness Value, q = 1 alpha = 0.05 : 0.076

Verbal interpretation of sensitivity statistics:

-- Partial R2 of the treatment with the outcome: an extreme confounder (orthogonal to the covariates)  that explains 100% of the residual variance of the outcome, would need to explain at least 2.187 % of the residual variance of the treatment to fully account for the observed estimated effect.

-- Robustness Value, q = 1 : unobserved confounders (orthogonal to the covariates) that  explain more than 13.878 % of the residual variance of both the treatment and the outcome are strong enough to bring the point estimate to 0.0 (a bias of 100.0 % of the original estimate). Conversely, unobserved confounders that do not explain more than 13.878 % of the residual variance of both the treatment and the outcome are not strong enough to bring the point estimate to 0.0 .

-- Robustness Value, q = 1 , alpha = 0.05 : unobserved confounders (orthogonal to the covariates) that explain more than 7.626 % of the residual variance of both the treatment and the outcome are strong enough to bring the estimate to a range where it is no longer 'statistically different' from 0.0 (a bias of 100.0 % of the original estimate), at the significance level of alpha = 0.05 . Conversely, unobserved confounders that do not explain more than 7.626 % of the residual variance of both the treatment and the outcome are not strong enough to bring the estimate to a range where it is no longer 'statistically different' from 0.0 , at the significance level of alpha = 0.05 .

Bounds on omitted variable bias:
--The table below shows the maximum strength of unobserved confounders with association with the treatment and the outcome bounded by a multiple of the observed explanatory power of the chosen benchmark covariate(s).

  bound_label    r2dz_x   r2yz_dx       treatment  adjusted_estimate  \
0   1x female  0.009164  0.124641  directlyharmed           0.075220
1   2x female  0.018329  0.249324  directlyharmed           0.052915
2   3x female  0.027493  0.374050  directlyharmed           0.030396

   adjusted_se  adjusted_t  adjusted_lower_CI  adjusted_upper_CI
0     0.021873    3.438904           0.032283           0.118158
1     0.020350    2.600246           0.012968           0.092862
2     0.018670    1.628062          -0.006253           0.067045
/usr/local/lib/python3.10/site-packages/sensemakr/sensitivity_statistics.py:177: FutureWarning: Series.__getitem__ treating keys as positions is deprecated. In a future version, integer keys will always be treated as labels (consistent with DataFrame behavior). To access a value by position, use `ser.iloc[pos]`
return (t_statistic ** 2 / (t_statistic ** 2 + dof))[0] # extracts float
Sensitivity Statistics
の箇所に部分決定係数が表示されている
Sensitivity Statistics:
  Partial R2 of treatment with outcome: 0.022
  Robustness Value, q = 1 : 0.139
  Robustness Value, q = 1 alpha = 0.05 : 0.076
Partial R2 of treatment with outcome:部分決定係数Robustness Value, q = 1: Robustness Value は未観測の交絡因子が処置変数と結果変数に与える影響を定量的に測る指標。値が大きいほど影響を受けないことを示す。例えばRobustness Valueが0.1なら、処置変数と結果変数の両方の残差の分散のうち10%を説明するほどの未観測の交絡因子が存在しない限り、処置の結果への影響はロバストであるという意味。
Robustness Value, q = 1 alpha = 0.05:統計的有意性も加味したもの。
# contour plot for the estimate
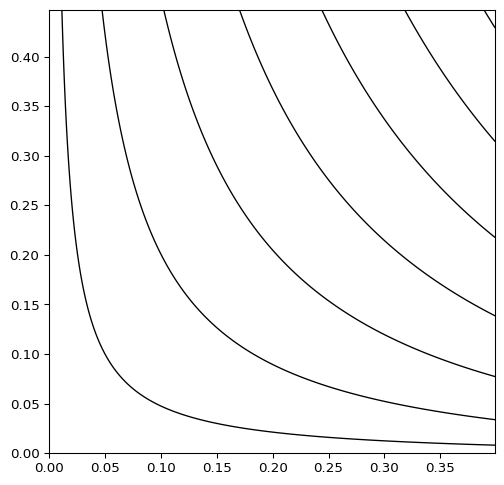
darfur_sense.plot()
---------------------------------------------------------------------------
AttributeError                            Traceback (most recent call last)
Cell In[4], line 2
      1 # contour plot for the estimate
----> 2 darfur_sense.plot()

File /usr/local/lib/python3.10/site-packages/sensemakr/main.py:443, in Sensemakr.plot(self, plot_type, sensitivity_of, **kwargs)
    408 """
    409 Provide the contour and extreme scenario sensitivity plots of the sensitivity analysis results obtained with the function Sensemakr.
    410
   (...)
    440 >>> sensitivity = smkr.Sensemakr(fitted_model, treatment = "directlyharmed", benchmark_covariates = "female", kd = [1, 2, 3])
    441 """
    442 if plot_type == 'contour':
--> 443     sensitivity_plots.ovb_contour_plot(sense_obj=self,sensitivity_of=sensitivity_of,**kwargs)
    444 elif (plot_type == 'extreme') and (sensitivity_of == 't-value'):
    445     sys.exit('Error: extreme plot for t-value has not been implemented yet')

File /usr/local/lib/python3.10/site-packages/sensemakr/sensitivity_plots.py:186, in ovb_contour_plot(sense_obj, sensitivity_of, model, treatment, estimate, se, dof, benchmark_covariates, kd, ky, r2dz_x, r2yz_dx, bound_label, reduce, estimate_threshold, t_threshold, lim, lim_y, col_contour, col_thr_line, label_text, label_bump_x, label_bump_y, xlab, ylab, plot_margin_fraction, round_dig, n_levels)
    184 if round_thr in cs_levels:
    185     threshold_index = cs_levels.index(round_thr)
--> 186     CS.collections[threshold_index].remove()
    187     # There's a conflict in matplotlib 3.8.2 with this remove method and ax.clabel
    188     # I'm currently commenting the line ax.clabel out but maybe there's a different way to do remove
    189     #ax.clabel(CS, inline=1, fontsize=8, fmt="%1.3g", colors="gray", levels=np.delete(CS.levels, threshold_index))
    190 else:
    191     ax.clabel(CS, inline=1, fontsize=8, fmt="%1.3g", colors="gray", levels=CS.levels)

AttributeError: 'QuadContourSet' object has no attribute 'collections'

# extreme scenarios plot
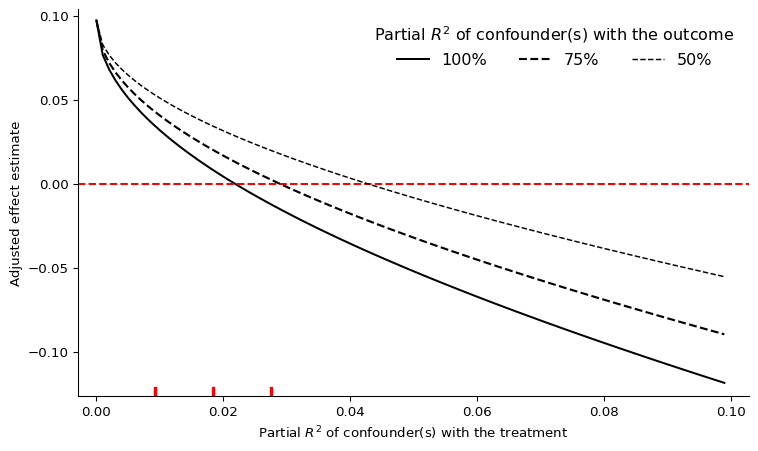
darfur_sense.plot(plot_type = 'extreme')

機械学習を利用した感度分析1:Veitch & Zaveri (2020)#
Veitch & Zaveri (2020)は機械学習を用いた感度分析を提案した
長所は
未観測の交絡因子が1つでも複数でも対応可能
非線形モデルにも対応可能
短所は
大体の傾向しか出せない
サンプル数が小さいと精度が低い
実装
機械学習を利用した感度分析2:Chernozhukov, et al. (2022)#
Chernozhukov, et al. (2022)は部分線形モデル(DML)の感度分析を提案
DoWhy documentation が概要の解説と実装の両面で参考になる
Semiparametric#
企業での利用例#
Uber#
Uberの因果推論フレームワークCeViChEにおいて感度分析を行っている
主に
プラセボテスト
関係のない交絡因子の追加・置換
サブセットデータを用いた検証
選択バイアスの検証
を行って多角的に感度分析している
Spotify#
タイトルの通り、Synthetic Controlの感度分析
著者のうちのVlontzosはSpotifyの人