確率分布の性質#
再生性#
確率変数の和が同じ確率分布になることを再生性という。
例えば、
Note
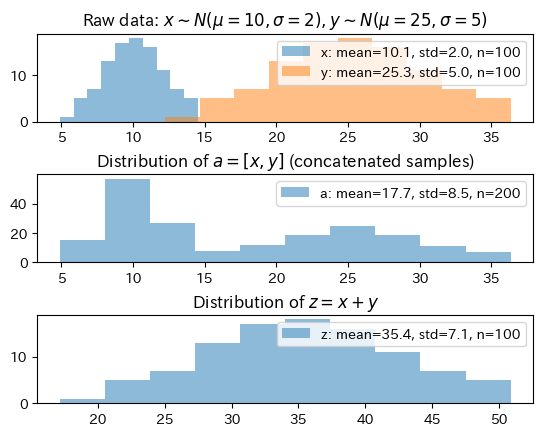
「再生性を持っていたとしても(例えば正規分布でも)、2つの分布を足したら2つの峰の分布になるのではないか?」と思われるかもしれない。
例えば、1つ目の分布から得た
仮にサンプルを連結するように足す、すなわち
という
しかし、再生性で議論しているのは
という演算である
Show code cell source
import matplotlib.pyplot as plt
import japanize_matplotlib
from scipy.stats import norm

x = norm.rvs(loc=10, scale=2, size=100, random_state=0)
y = norm.rvs(loc=25, scale=5, size=100, random_state=0)

def info(x):
    return f"mean={x.mean():.1f}, std={x.std():.1f}, n={len(x)}"


fig, axes = plt.subplots(nrows=3)
fig.subplots_adjust(hspace=0.6)
axes[0].hist(x, label=f"x: {info(x)}", alpha=.5)
axes[0].hist(y, label=f"y: {info(y)}", alpha=.5)
axes[0].set(title=r"Raw data: $x \sim N(\mu=10, \sigma=2), y \sim N(\mu=25, \sigma=5)$")
axes[0].legend()


# もしレコードを結合するなら、2峰の分布になる
import numpy as np
a = np.append(x, y)
axes[1].hist(a, label=f"a: {info(a)}", alpha=.5)
axes[1].legend()
axes[1].set(title=f"Distribution of $a = [x, y]$ (concatenated samples)")


# レコードを結合するのではなく、サンプルごとに和をとっている点に注意
z = x + y
axes[2].hist(z, label=f"z: {info(z)}", alpha=.5)
axes[2].legend()
axes[2].set(title=f"Distribution of $z = x + y$")

fig.show()
