極値#
極大と極小#
ある関数\(y=f(x)\)があるとする。
ある点\(a\)での値\(f(a)\)がその近くでのほかの値\(f(a+h), (h\neq 0)\)より大きい場合、\(f(x)\)は\(a\)で 極大 (maximum)になるといい、\(f(a)\)を 極大値 という。
ある点\(a\)での値\(f(a)\)がその近くでのほかの値\(f(a+h), (h\neq 0)\)より小さい場合、\(f(x)\)は\(a\)で 極小 (minimum)になるといい、\(f(a)\)を 極小値 という。
極大値と極小値を総称して 極値 という。
極値の判定#
極値の条件#
極値の条件
関数 \(y=f(x)\) が \(c \leqq x \leqq e\) で微分可能であり、 点 \(x_0(c<x_0<e)\) で極大值または 極小値をとるならば、 \(f^{\prime}(x_0)=0\) である。
証明
点\(x=x_0\)で\(f(x)\)が極大値を取るとする。極値の定義から、\(f(x_0 + h) < f(x_0)\)、すなわち
\(h>0\) ならぱ
\(h<0\) ならば
よって
なので \(0 \leqq f^{\prime}\left(x_0\right) \leqq 0\) より、 \(f^{\prime}\left(x_0\right)=0\)
極値の判定法#
導関数のふるまいで極値を判定できる。まとめると次のようになる。
\(x\) が増加しながら \(x_0\) を通過するとき
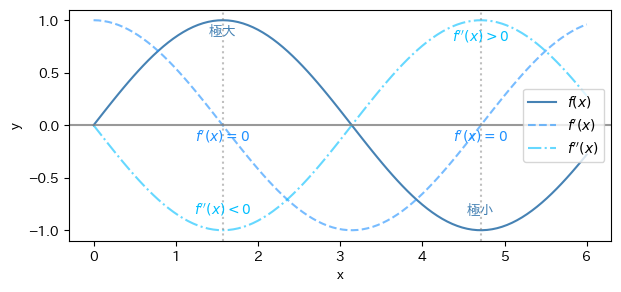
導関数 \(f^{\prime}(x)\) が正から 0 を通って負に符号をかえるならば、\(f(x)\) は \(x=x_0\) で極大值 \(f\left(x_0\right)\) をもつ。
導関数 \(f^{\prime}(x)\) が負から 0 を通って正に符号をかえるならば、\(f(x)\) は \(x=x_0\) で極小值 \(f\left(x_0\right)\) をもつ。
導関数 \(f^{\prime}(x)\) が符号をかえないならば、 \(f^{\prime}\left(x_0\right)=0\) であっても、\(f(x)\) は \(x=x_0\) で極大にも極小にもならない
\(f'(x)\)の符号の判定に2次導関数\(f''(x)\)を使うことができる。
\(f'(x_0)=0\)のとき、\(f''(x_0) < 0\)であることは\(f'(x)\)が減少状態であり、\(x=x_0\)において正から0を通って負になることがわかる。
\(f'(x_0)=0\)のとき、\(f''(x_0) > 0\)であることは\(f'(x)\)が増加状態であり、\(x=x_0\)において負から0を通って正になることがわかる。
よって、きょくちのはんて
極値の判定法
(1) \(f^{\prime}\left(x_0\right)=0, f^{\prime \prime}\left(x_0\right)<0\) ならば、 関数 \(f(x)\) は \(x=x_0\) で極大值 \(f\left(x_0\right)\) をとる。
(2) \(f^{\prime}\left(x_0\right)=0, f^{\prime \prime}\left(x_0\right)>0\) ならば、 関数 \(f(x)\) は \(x=x_0\) で極小値 \(f\left(x_0\right)\) をとる。
最大値と最小値#
閉区間\(a \leq x \leq b\)で連続な関数\(f(x)\)の最大値と最小値を考える。
この場合、次の2点に注意する必要がある。
区間内に極大(または極小)になる点が複数あり得るため、それらを比べて最大値(最小値)を探索する必要がある
区間の端点\(a, b\)が最大値(最小値)になる可能性があるため、端点とも比較する必要がある