import numpy as np
import pandas as pd
import matplotlib.pyplot as plt
import seaborn as sns

# data -------------------------
np.random.seed(0)
n = 10
beta_0 = 5
beta_1 = 10
x = np.sort(np.random.uniform(size=n))
e = np.random.normal(scale=2, size=n)
y = beta_0 + beta_1 * x + e

# calc RSS ---------------------
def rss(y_true, x, beta_0, beta_1):
    y_pred = beta_0 + beta_1 * x
    return sum((y_true - y_pred)**2)

beta_0_range = np.linspace(-5, 20, 26)
beta_1_range = np.linspace(-5, 20, 26)
Beta0, Beta1 = np.meshgrid(beta_0_range, beta_1_range)
Loss = np.array([rss(y, x, b0, b1) for b0, b1 in zip(Beta0.flatten(), Beta1.flatten())]).reshape(Beta0.shape)

# OLS estimate ------------------
beta_1_hat = np.cov(x, y)[0, 1] / np.var(x)
beta_0_hat = y.mean() - beta_1_hat * x.mean()
loss_ = rss(y, x, beta_0_hat, beta_1_hat)
color_ols = "black"

# wrong estimate
beta_wrongs = [(15, -4), (5, 9)]
color_wrong = "red"

# plot ---------------------------
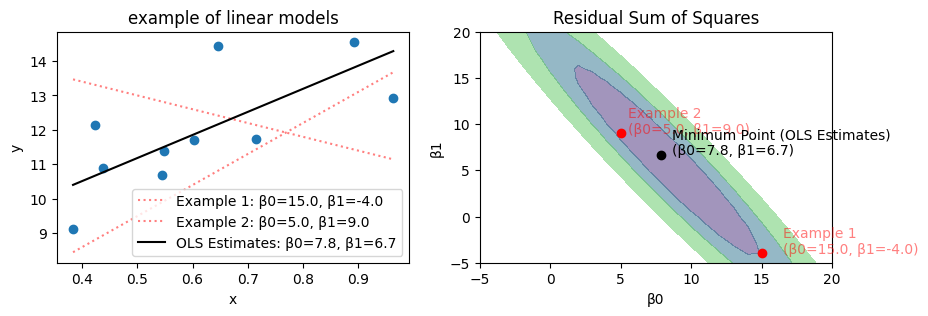
fig, axes = plt.subplots(ncols=2, figsize=[10,3])

# scatter
axes[0].scatter(x, y)
axes[0].set(xlabel="x", ylabel="y", title="example of linear models")

for i, (b0, b1) in enumerate(beta_wrongs, 1):
    y_pred = b0 + b1 * x
    axes[0].plot(x, y_pred, label=f"Example {i}: β0={b0:.1f}, β1={b1:.1f}", color=color_wrong, linestyle=":", alpha=.5)

y_pred = beta_0_hat + beta_1_hat * x
axes[0].plot(x, y_pred, label=f"OLS Estimates: β0={beta_0_hat:.1f}, β1={beta_1_hat:.1f}", color=color_ols)

axes[0].legend(loc="lower right")

# RSS
cs = axes[1].contourf(Beta0, Beta1, Loss, levels=[0, 50, 100, 200], alpha=0.5)
axes[1].set(xlabel="β0", ylabel="β1", title="Residual Sum of Squares")

for i, (b0, b1) in enumerate(beta_wrongs, 1):
    axes[1].scatter(b0, b1, color=color_wrong)
    axes[1].text(b0 * 1.1, b1, f"Example {i}\n(β0={b0:.1f}, β1={b1:.1f})", color=color_wrong, alpha=.5)

axes[1].scatter(beta_0_hat, beta_1_hat, color=color_ols)
axes[1].text(beta_0_hat * 1.1, beta_1_hat, f"Minimum Point (OLS Estimates)\n(β0={beta_0_hat:.1f}, β1={beta_1_hat:.1f})", color=color_ols)

fig.show()

# # 3d plot --------------------
# from matplotlib import cm
# fig, ax = plt.subplots(dpi=120, subplot_kw={"projection": "3d"})
# surf = ax.plot_surface(Beta0, Beta1, Loss, rstride=1, cstride=1, linewidth=1, antialiased=True, cmap=cm.coolwarm)
# fig.colorbar(surf, shrink=0.5, aspect=5, pad=0.11)
# ax.set(xlabel="beta_0", ylabel="beta_1", zlabel="Residual Sum of Squares")

# # # add a point
# # ax.scatter(beta_0_hat, beta_1_hat, loss_, color="darkorange")
# # ax.text(beta_0_hat * 0.99, beta_1_hat, loss_ * 1.1, f"Lowest point (β0={beta_0_hat:.1f}, β1={beta_1_hat:.1f})", color="darkorange")

# fig.show()
