from PIL import Image, ImageDraw, ImageFont

def create_image():
    # 画像サイズを指定
    img_width, img_height = 400, 600
    # 背景色の指定(白)
    background_color = (255, 255, 255)
    # 画像の作成
    image = Image.new('RGB', (img_width, img_height), background_color)
    draw = ImageDraw.Draw(image)

    font = ImageFont.load_default()

    # タイトルの描画
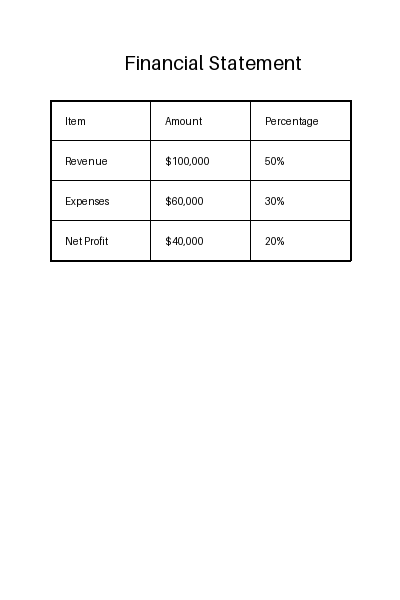
    title = "Financial Statement"
    title_position = (img_width // 2 - len(title) * 4, 50)
    draw.text(title_position, title, fill=(0, 0, 0), font=ImageFont.load_default(size=20))

    width = 100
    margin = 15

    # 表のヘッダー部分
    headers = ["Item", "Amount", "Percentage"]
    header_position = (50, 100)
    for i, header in enumerate(headers):
        draw.text((header_position[0] + i * width + margin, header_position[1] + margin), header, fill=(0, 0, 0), font=font)

    # 表データの例
    data = [
        ("Revenue", "$100,000", "50%"),
        ("Expenses", "$60,000", "30%"),
        ("Net Profit", "$40,000", "20%")
    ]

    # 表の内容を描画
    for row, (item, amount, percentage) in enumerate(data):
        cols = (item, amount, percentage)
        for j, value in enumerate(cols):
            draw.text((header_position[0] + j * width + margin, header_position[1] + (row + 1) * 40 + margin), value, fill=(0, 0, 0), font=font)

    # 表の線を描画
    line_start_x, line_end_x = 50, 350
    row_idx = list(range(len(data) + 2))
    for i in range(len(data) + 2):
        y = header_position[1] + i * 40
        line_width = 2 if i in (min(row_idx), max(row_idx)) else 1
        draw.line([(line_start_x, y), (line_end_x, y)], fill=(0, 0, 0), width=line_width)

    # 垂直線を描画
    ncols = len(cols)
    col_idx = list(range(ncols + 1))
    for j in range(ncols + 1):
        line_width = 2 if j in (min(col_idx), max(col_idx)) else 1
        draw.line([(line_start_x + j * width, header_position[1]),
                   (line_start_x + j * width, header_position[1] + (len(data) + 1) * 40)],
                  fill=(0, 0, 0), width=line_width)
    return image

image = create_image()
image

