Kendall の順位相関係数(Kendall’s τ)

Contents

Kendall の順位相関係数(Kendall’s τ)#

Kendall の \(\tau\) は観測値の全ペアの数に対する順序が一致(concordant)/ 不一致(discordant)のペアの数の比率のように定義される相関係数

定義式#

\[ \tau = \frac{C - D}{\binom{n}{2}} \]
  • \(C\):一致ペア数

  • \(D\):不一致ペア数

  • \(\binom{n}{2}\):全ペア数

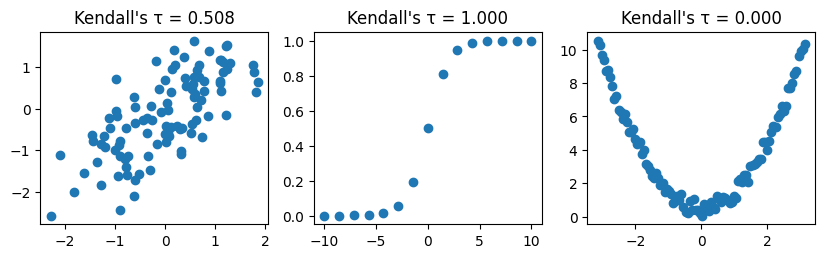
  • 順位が完全に一致している(すなわち\(D = 0\))なら\(\tau = +1\)

  • 順位が完全に不一致(すなわち\(C = 0\))なら\(\tau = -1\)

特徴#

  • 単調関係を捉える

  • ノイズが強い場合に Spearman より安定する場合がある

  • 値域は \([-1,1]\)

Hide code cell source

from scipy.stats import kendalltau
import matplotlib.pyplot as plt
import numpy as np

fig, axes = plt.subplots(figsize=[10, 2.5], ncols=3)

true_r = 0.75
mu = np.array([0.0, 0.0])
Sigma = np.array([[1.0, true_r], [true_r, 1.0]])
samples = np.random.multivariate_normal(mu, Sigma, size=100)
x = samples[:, 0]
y = samples[:, 1]
axes[0].scatter(x, y)
axes[0].set_title(f"Kendall's τ = {kendalltau(x, y).statistic:.3f}")

x = np.linspace(-10, 10, 15)
y = 1 / (1 + np.exp(-x))
axes[1].scatter(x, y)
axes[1].set_title(f"Kendall's τ = {kendalltau(x, y).statistic:.3f}")

x = np.linspace(-3.14,3.14, 100)
y = x**2 + np.random.random(len(x))
axes[2].scatter(x, y)
axes[2].set_title(f"Kendall's τ = {kendalltau(x, y).statistic:.3f}")

%matplotlib inline
../../../_images/b3833dc771675d1494b19e987b52fda65a7f01b7e905e081ae57e39f08f13d21.png